基于macos平台搭建vscode调试环境
搭建环境
- 集成开发环境:MxSrvs
- 代码编辑器:Visual Studio Code (Vscode)
- 操作系统类型:Macos
集成开发环境下载地址:https://pan.baidu.com/s/1xZI65zE5hppgobjiRtHTJA?pwd=aejb
代码编辑器下载地址:https://code.visualstudio.com/
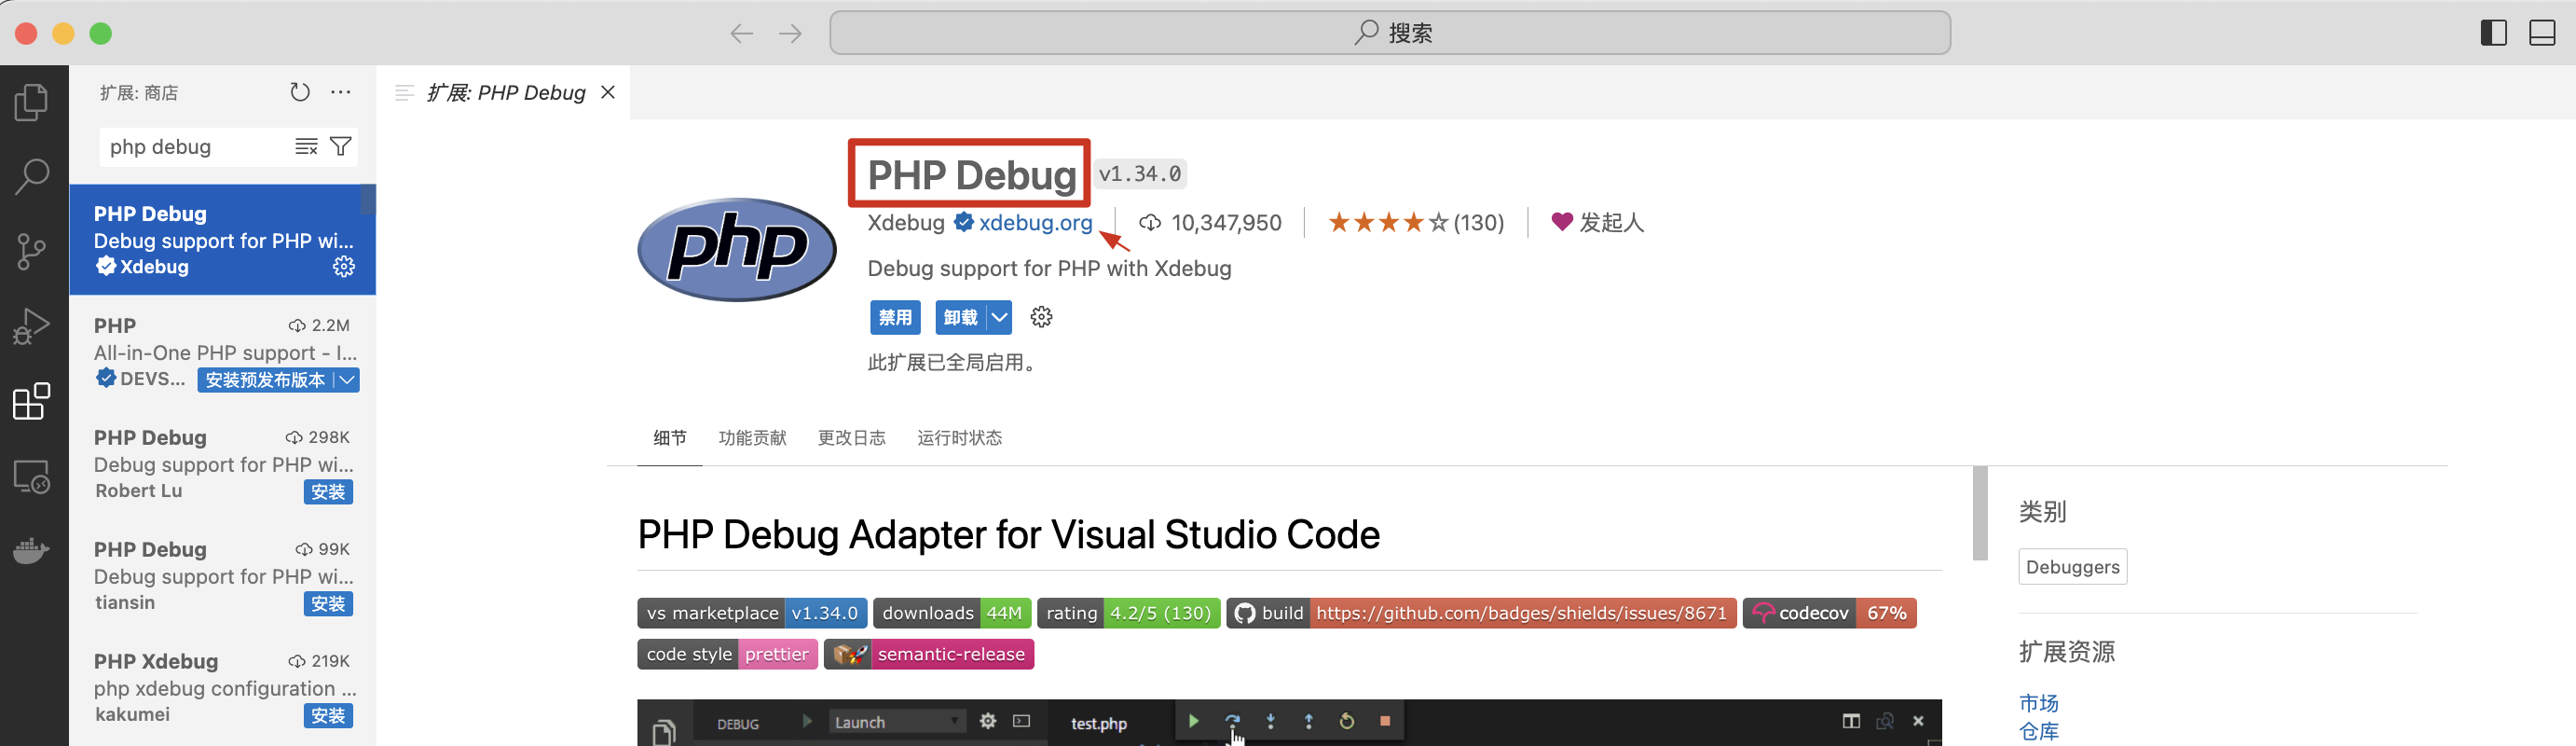
vscode安装相应插件
插件名称:PHP Debug
vscode配置
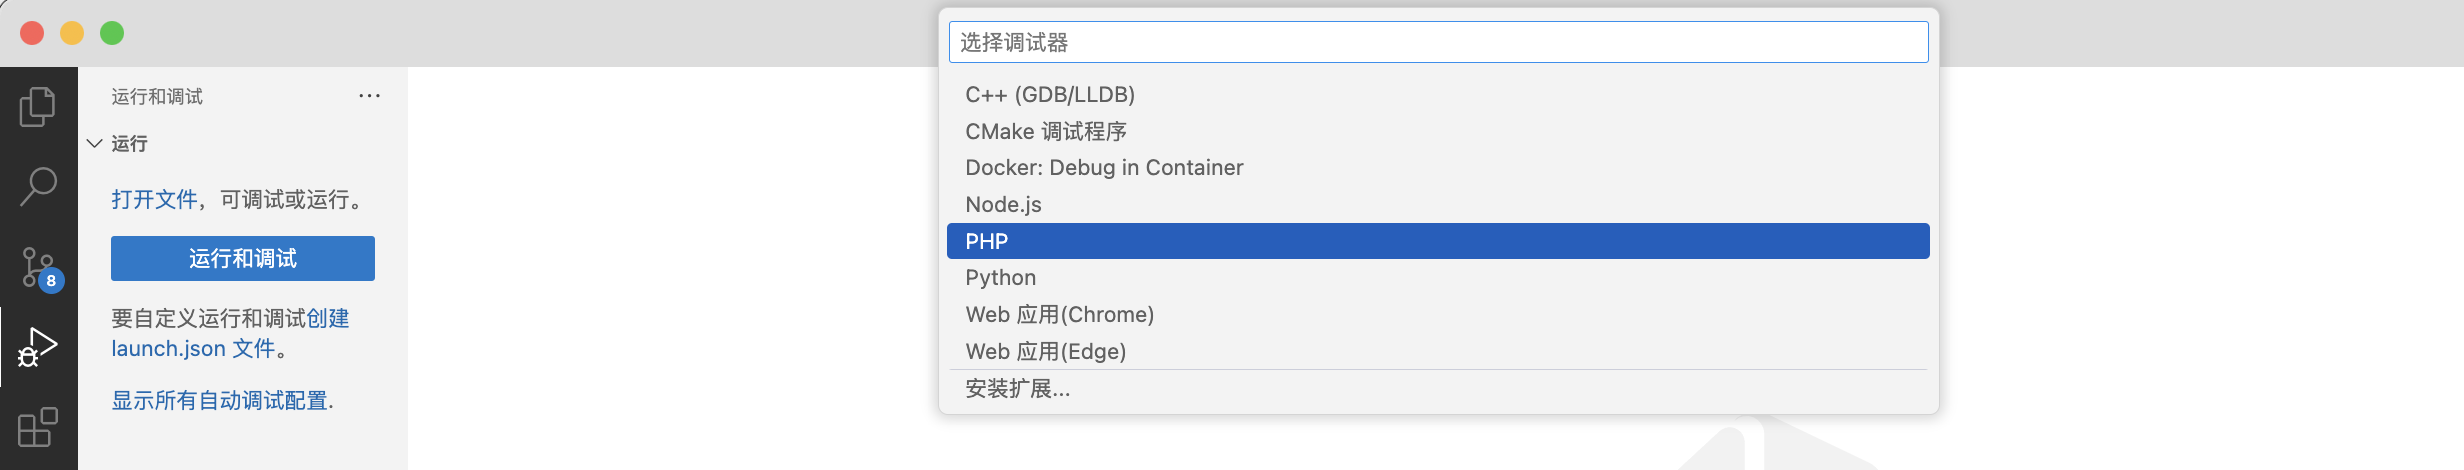
点击 vscode 左侧的运行和调试,接着点击 创建launch.json文件
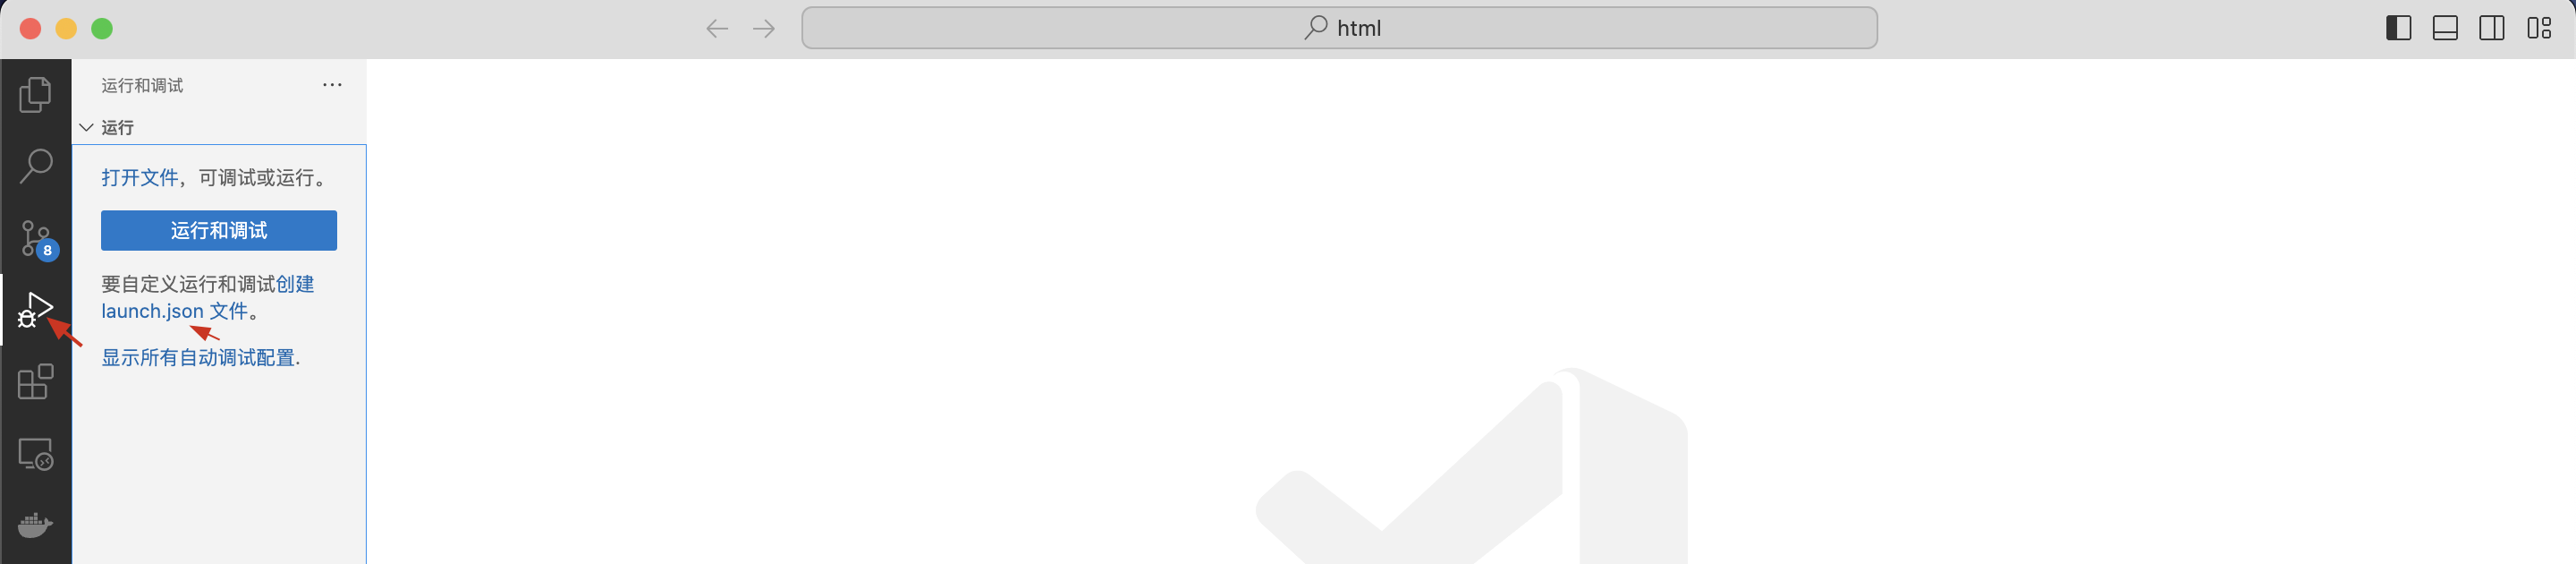
调试器选择 PHP
以下配置保持默认即可:
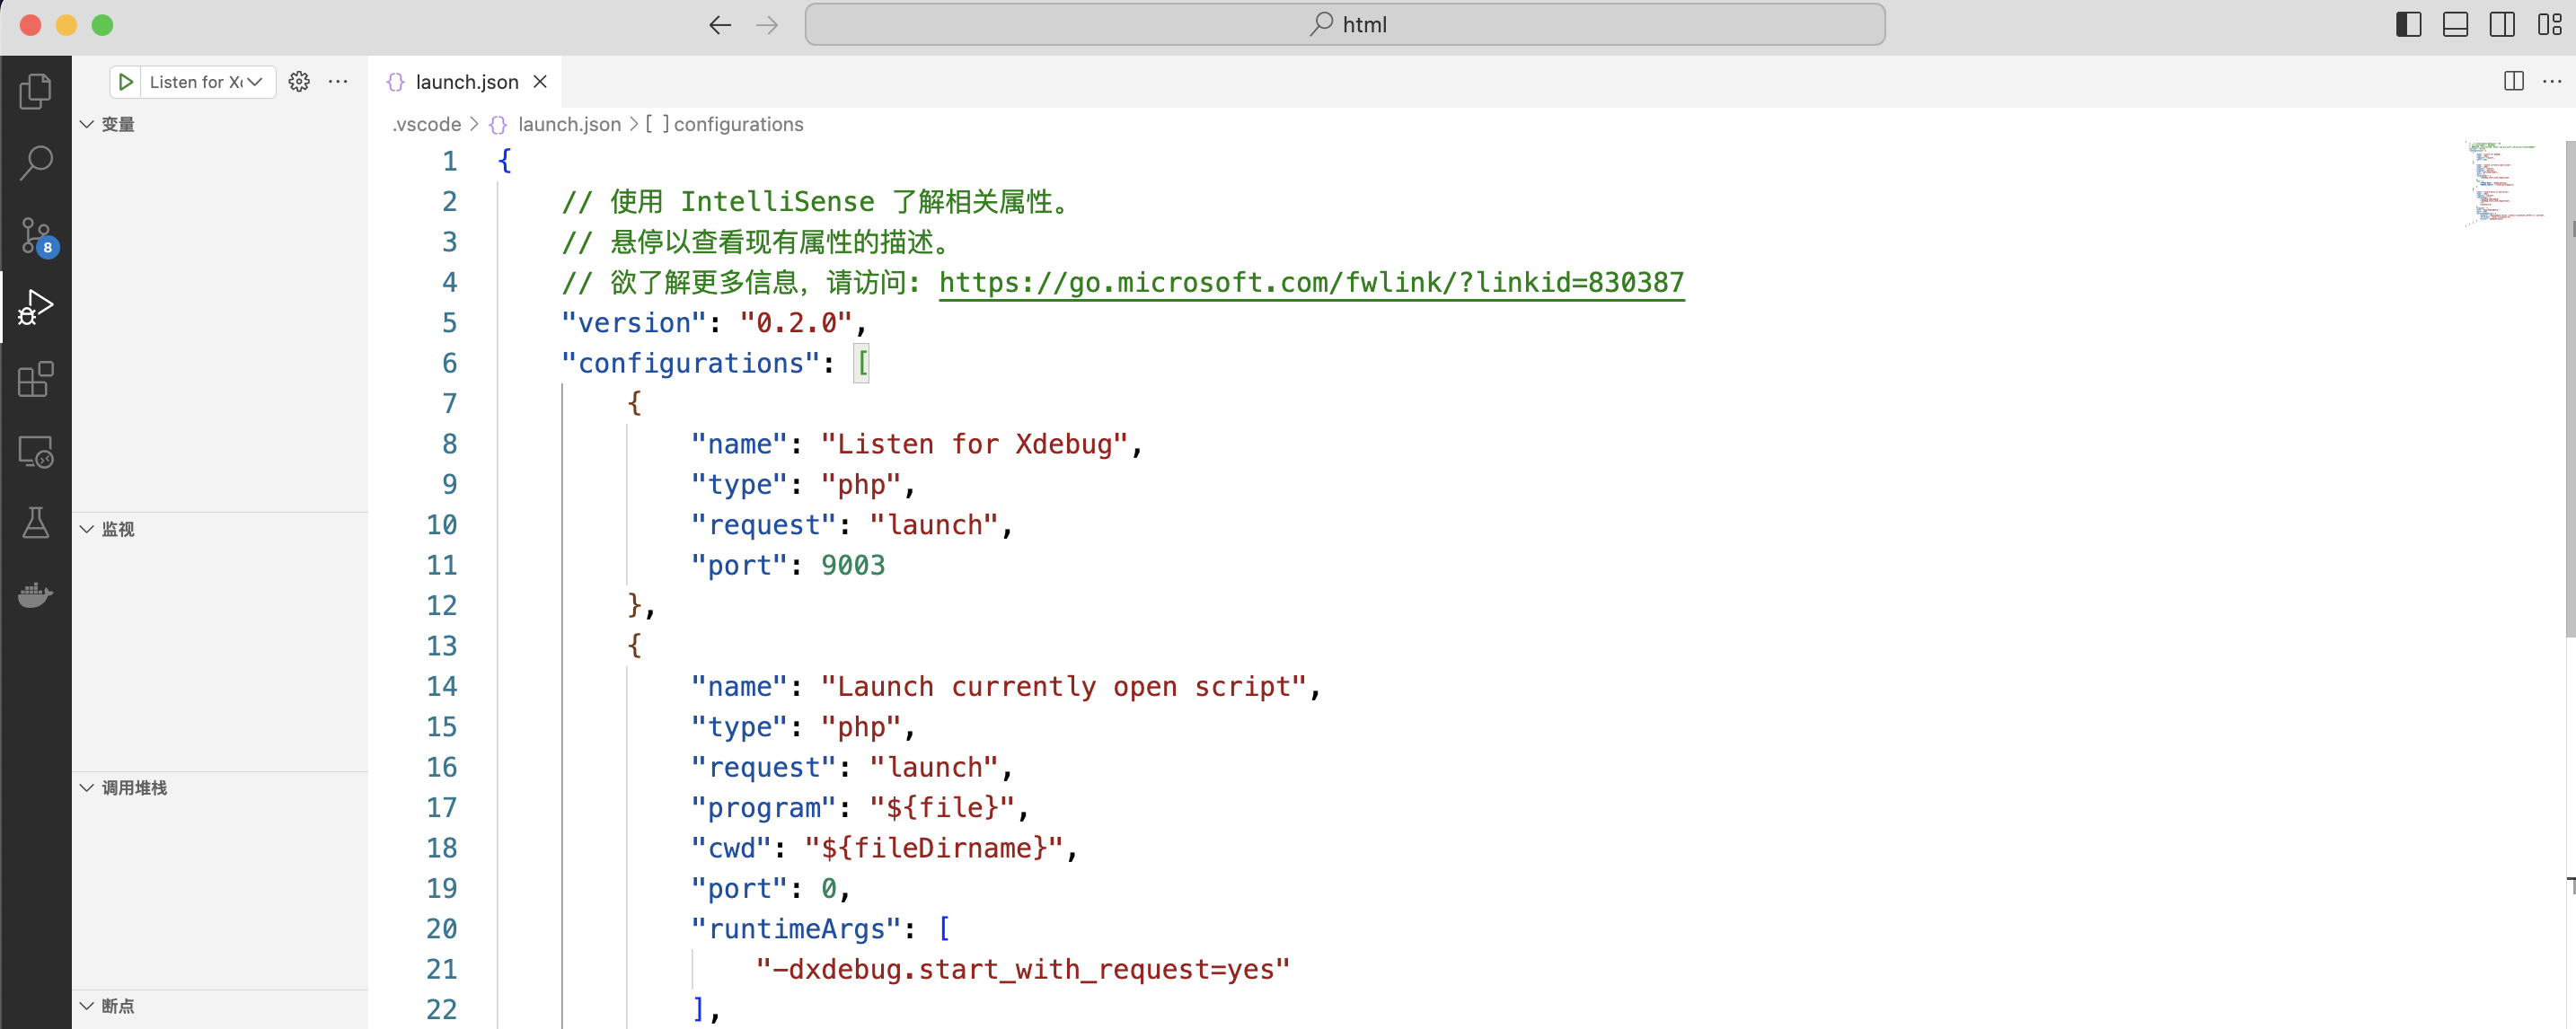
launch.json 配置文件内容如下:
1
2
3
4
5
6
7
8
9
10
11
12
13
14
15
16
17
18
19
20
21
22
23
24
25
26
27
28
29
30
31
32
33
34
35
36
37
38
39
40
41
42
43
44
45
46
47
48
| {
"version": "0.2.0",
"configurations": [
{
"name": "Listen for Xdebug",
"type": "php",
"request": "launch",
"port": 9003
},
{
"name": "Launch currently open script",
"type": "php",
"request": "launch",
"program": "${file}",
"cwd": "${fileDirname}",
"port": 0,
"runtimeArgs": [
"-dxdebug.start_with_request=yes"
],
"env": {
"XDEBUG_MODE": "debug,develop",
"XDEBUG_CONFIG": "client_port=${port}"
}
},
{
"name": "Launch Built-in web server",
"type": "php",
"request": "launch",
"runtimeArgs": [
"-dxdebug.mode=debug",
"-dxdebug.start_with_request=yes",
"-S",
"localhost:0"
],
"program": "",
"cwd": "${workspaceRoot}",
"port": 9003,
"serverReadyAction": {
"pattern": "Development Server \\(http://localhost:([0-9]+)\\) started",
"uriFormat": "http://localhost:%s",
"action": "openExternally"
}
}
]
}
|
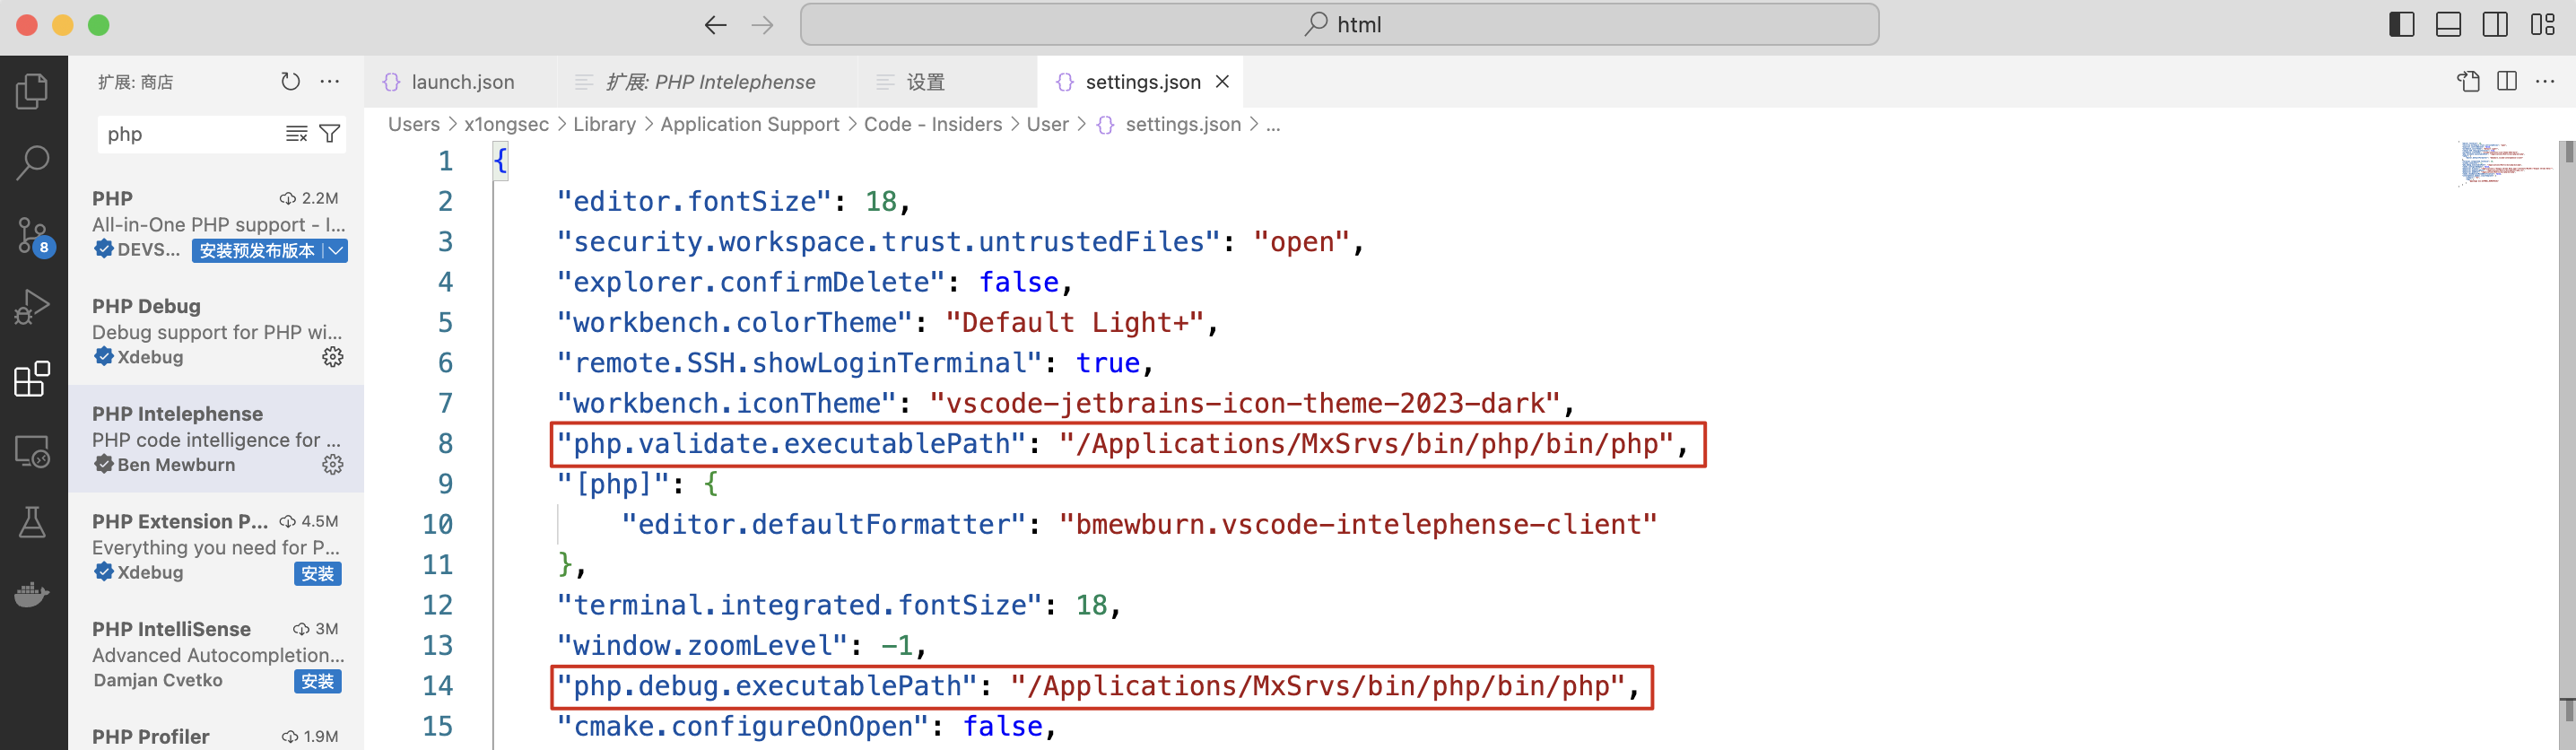
按住 command + , 进入到 vscode 的设置,搜索 php.validate.executablePath
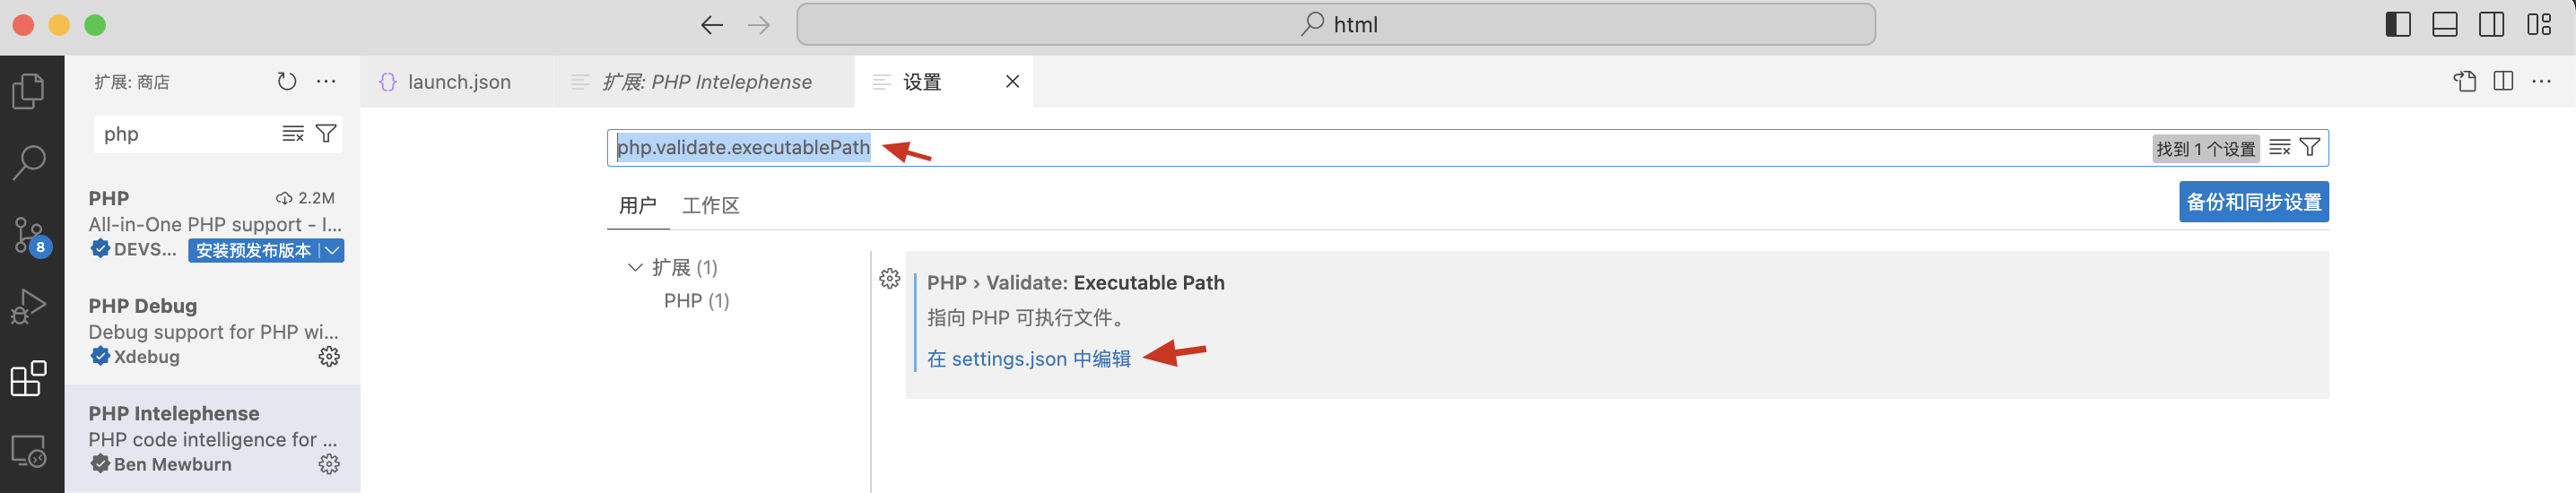
添加或修改如下配置,将其修改为PHP程序的绝对路径。
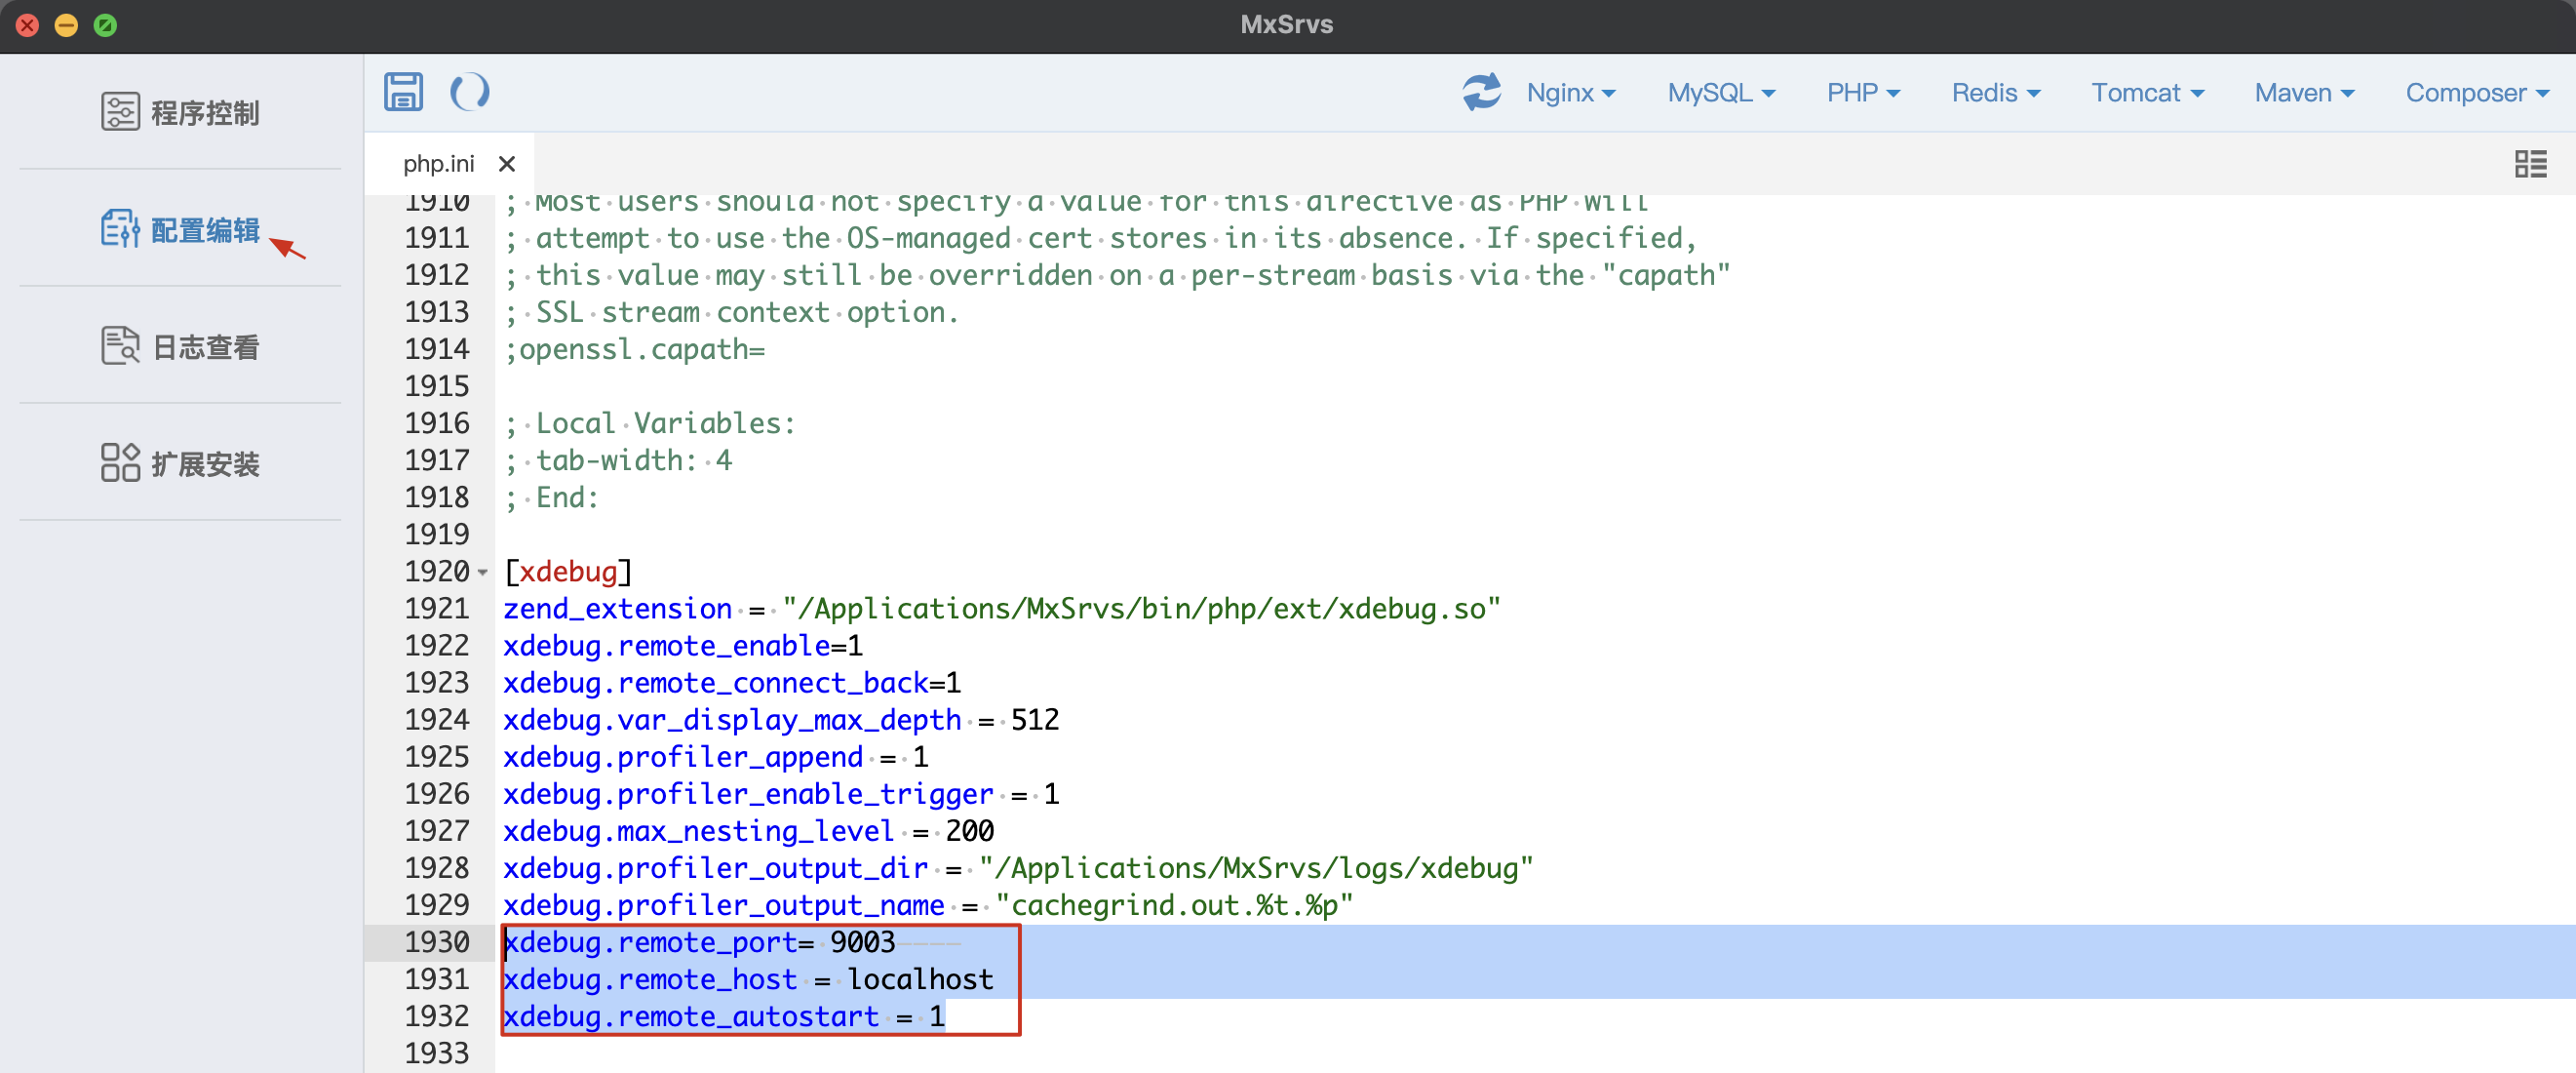
Mxsrvs配置
打开 Mxsrvs 找到 配置编辑 点击 PHP 编辑 php.ini ,并在最底部的 xdebug 处添加如下内容:
1
2
3
4
|
xdebug.remote_port= 9003
xdebug.remote_host = localhost
xdebug.remote_autostart = 1
|
接着重启PHP程序即可。
本地调试
在网站根目录下创建 index.php 文件,内容如下:
1
2
3
4
5
6
7
8
9
10
11
12
13
14
15
16
17
18
19
| <?php
error_reporting(0);
function add($x,$y)
{
$total=$x+$y;
return $total;
}
$a = $_REQUEST['a'];
$b = $_REQUEST['b'];
if(isset($a) && isset($b)){
echo "$a + $b = " . add($a,$b);
}else{
echo "www.qwesec.com";
}
?>
|
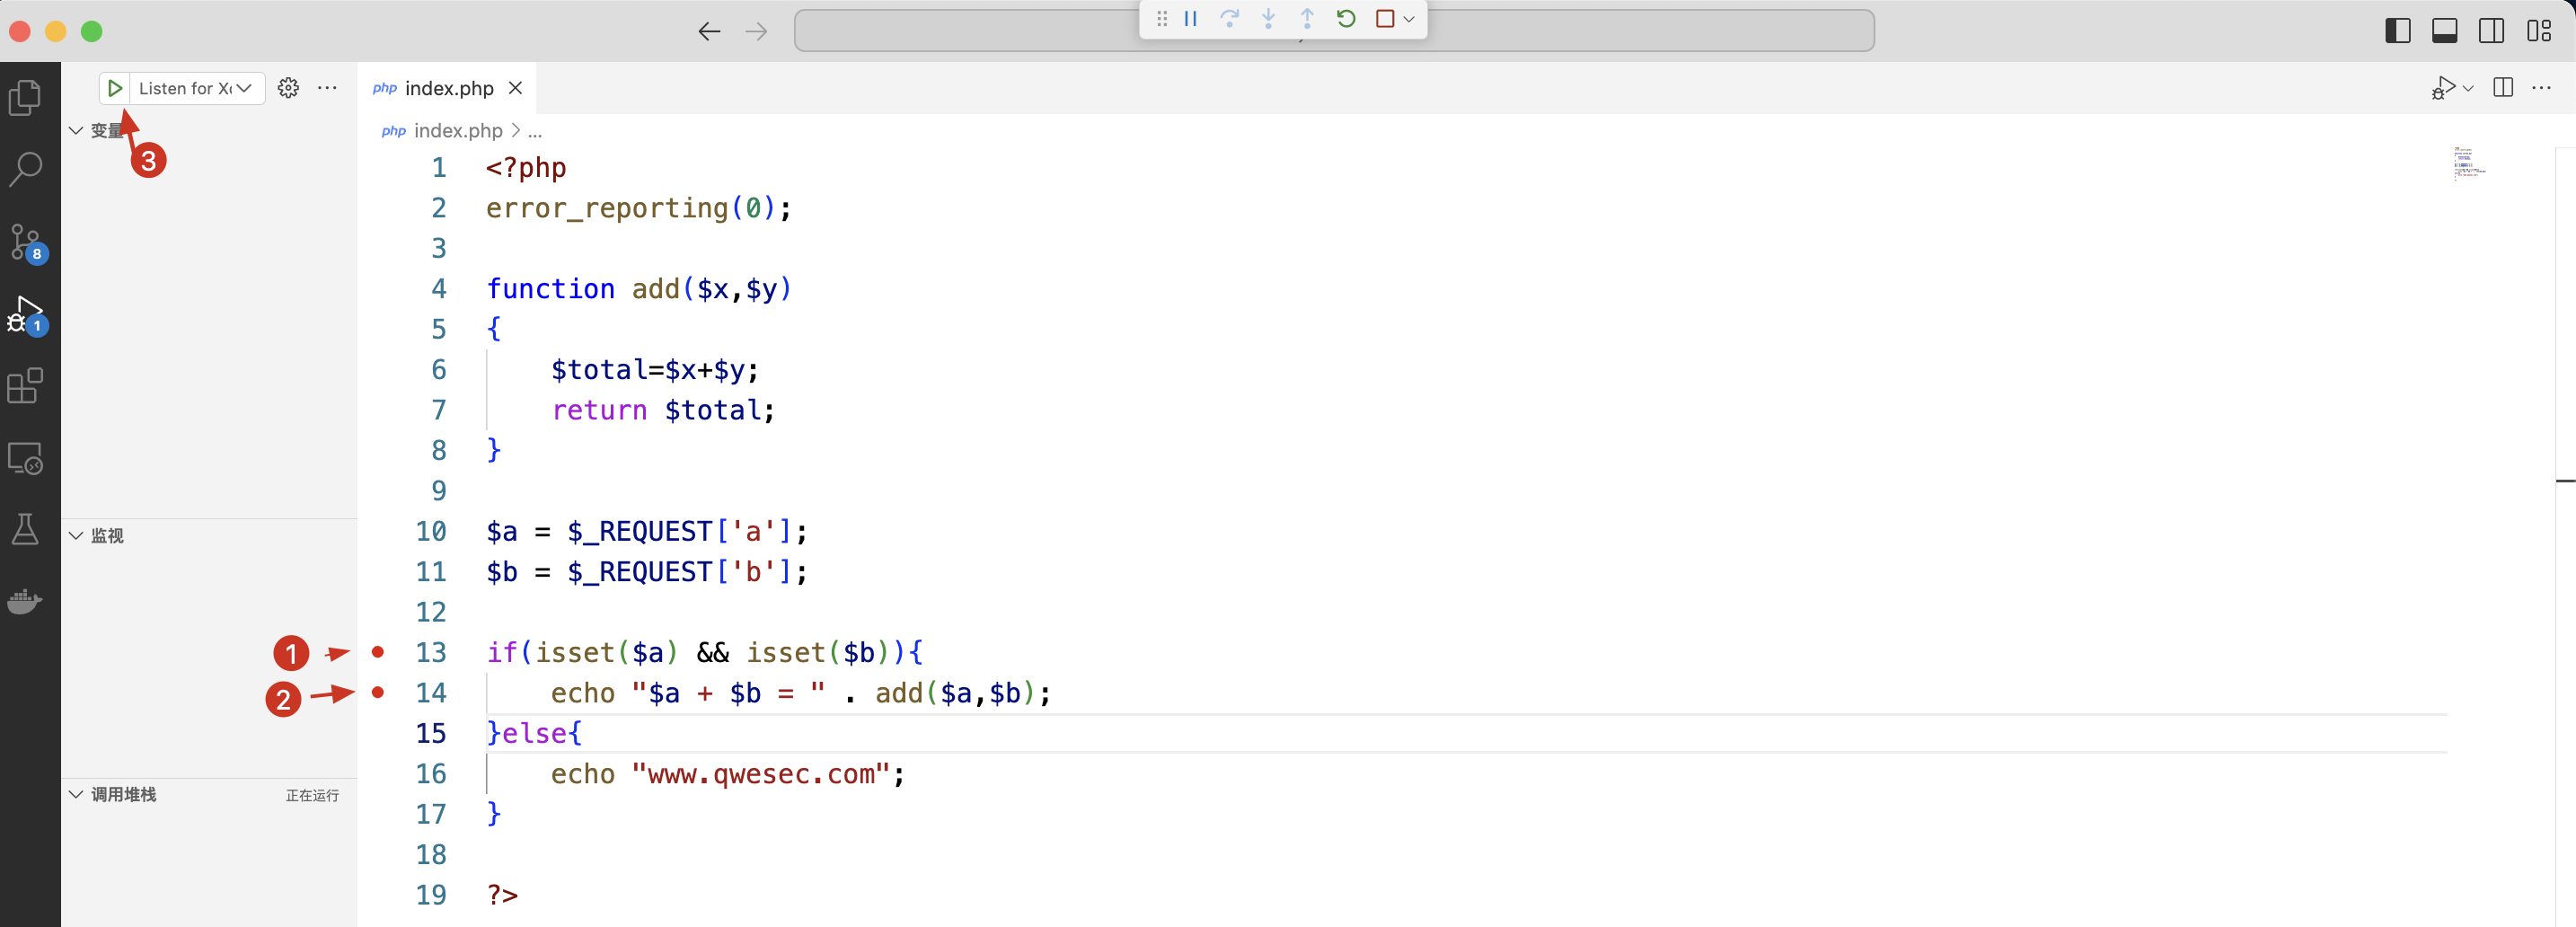
并在想拦截的代码行处打上断点(点击即可),接着点击做侧边栏的 运行和调试 接着点击 Listen for Xdebug,此时已经开始调试了。
使用浏览器访问该文件,并传入参数 ?a=10&b=20
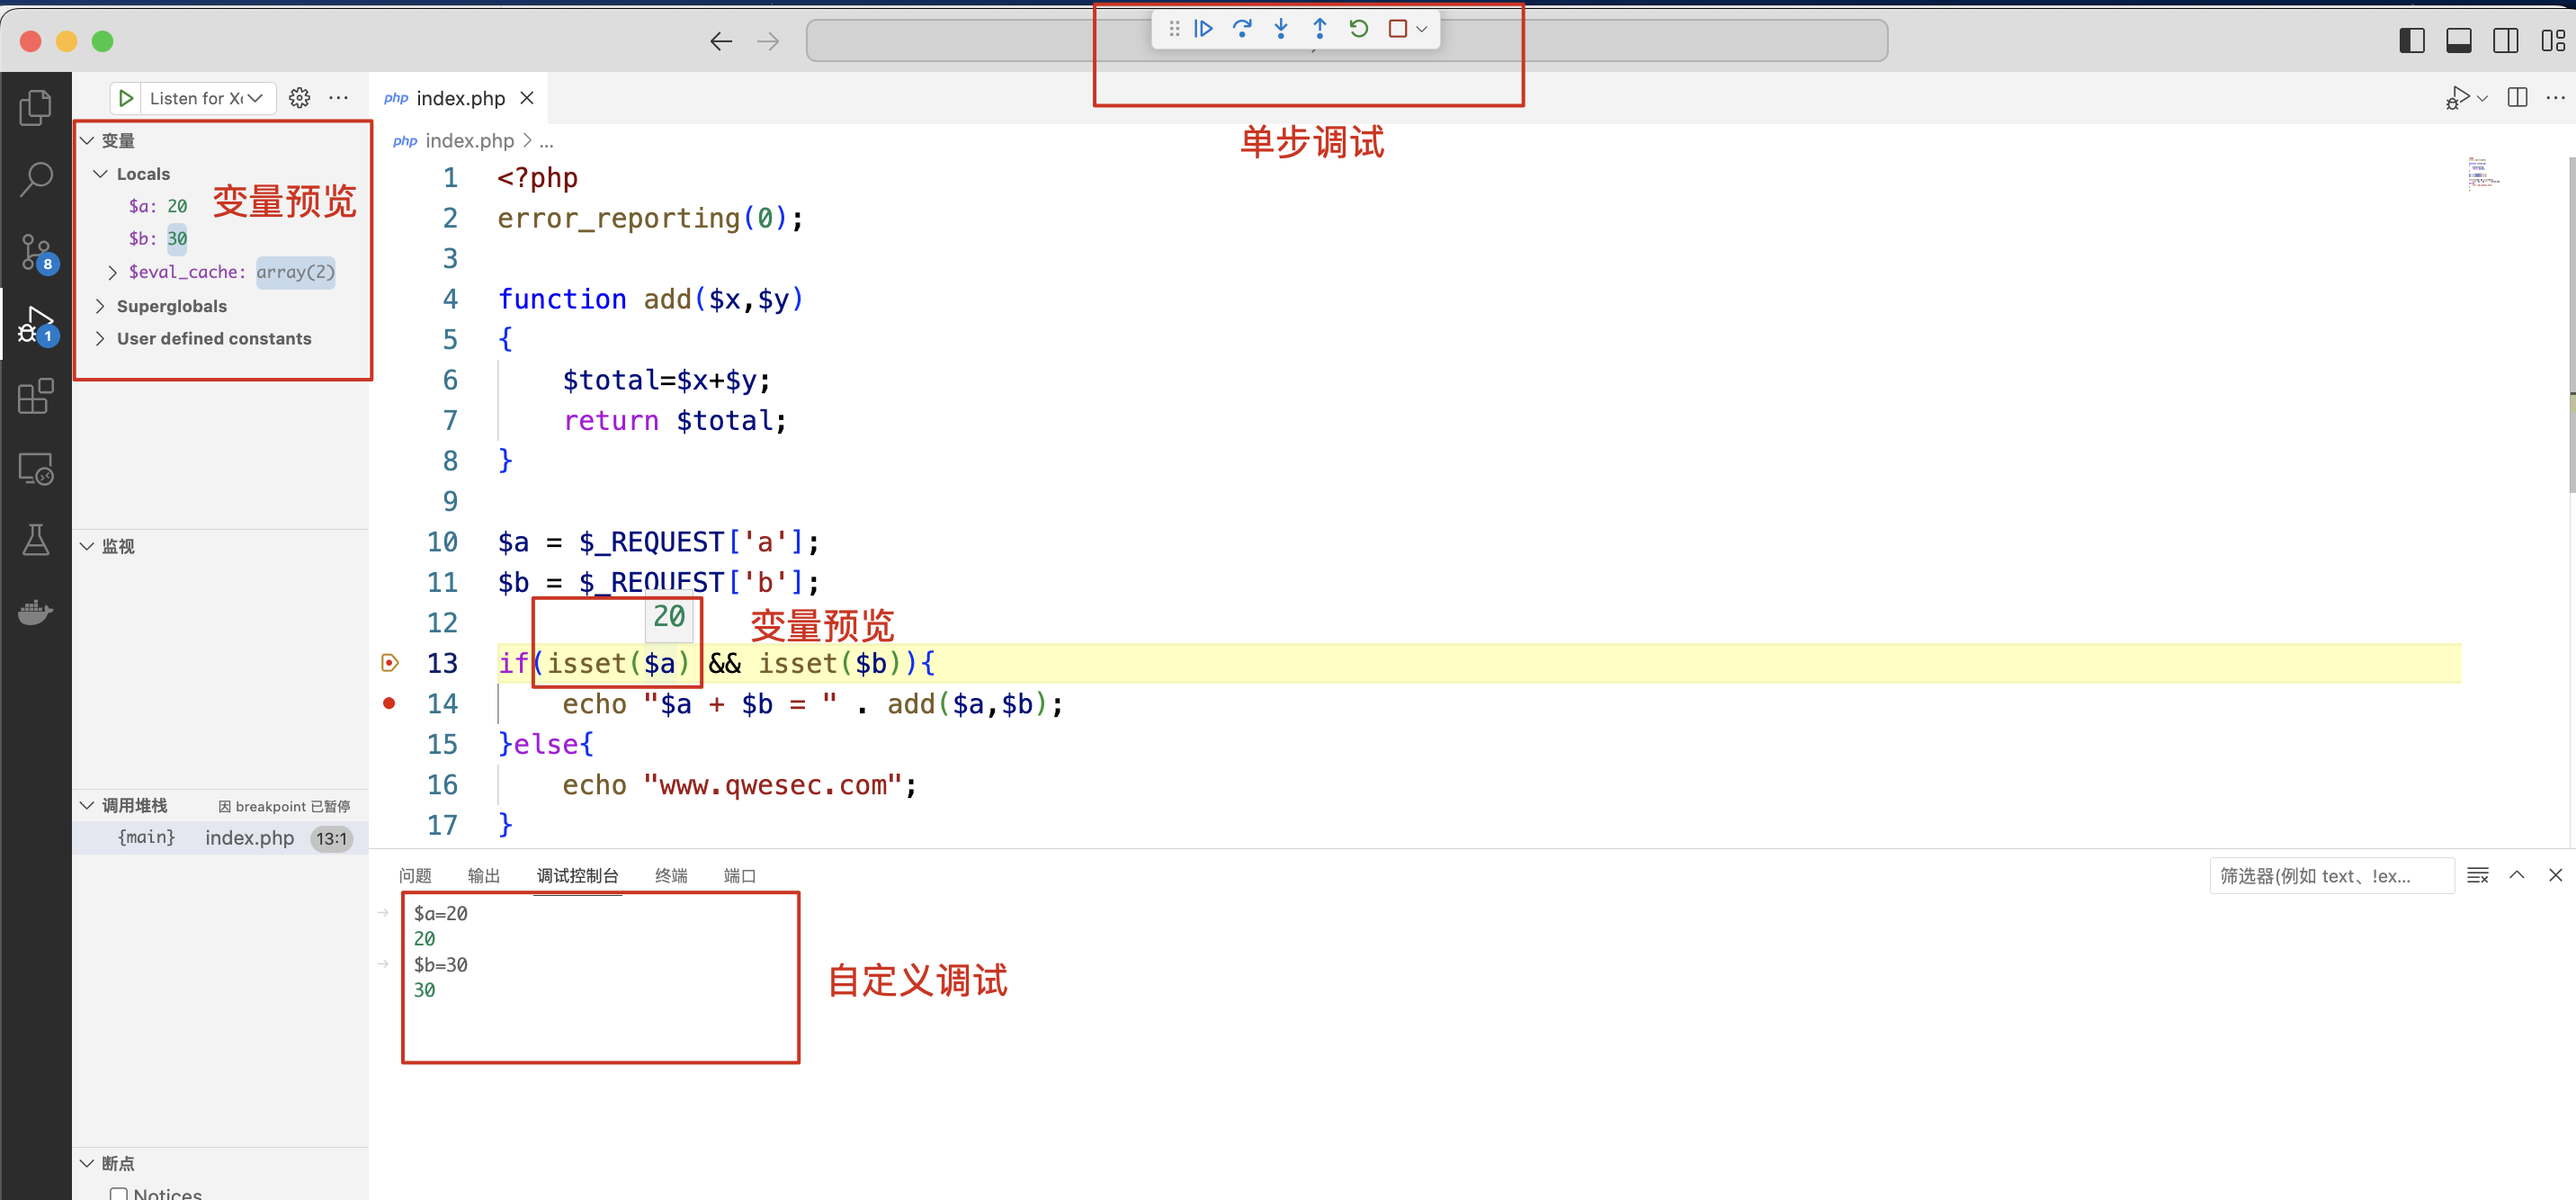
单步调试按钮功能:
- F5 启动调试。若已经启动,则会运行到下一个断点停住(执行到下一个断点)
- F10 单步跳过。即如果遇到函数,则不会进到这个函数里面
- F11 单步执行。如果遇到函数,会进到这个函数里面
- Shift+F11 单步跳出 直接执行完这个函数,返回调用的前一个函数
- Shift+F5 结束调试
分别对应如下按钮:

基于Windows平台搭建vscode调试环境
搭建环境
- 集成开发环境:phpstudy 2018
- 代码编辑器:Visual Studio Code (Vscode)
- 操作系统类型:Macos
集成开发环境下载地址:https://x1ong.lanzouq.com/ipBXo1fbw7sf
代码编辑器下载地址:https://code.visualstudio.com/
其他步骤
其他步骤与macos搭建vscode调试环境一致。请参考上述文章。
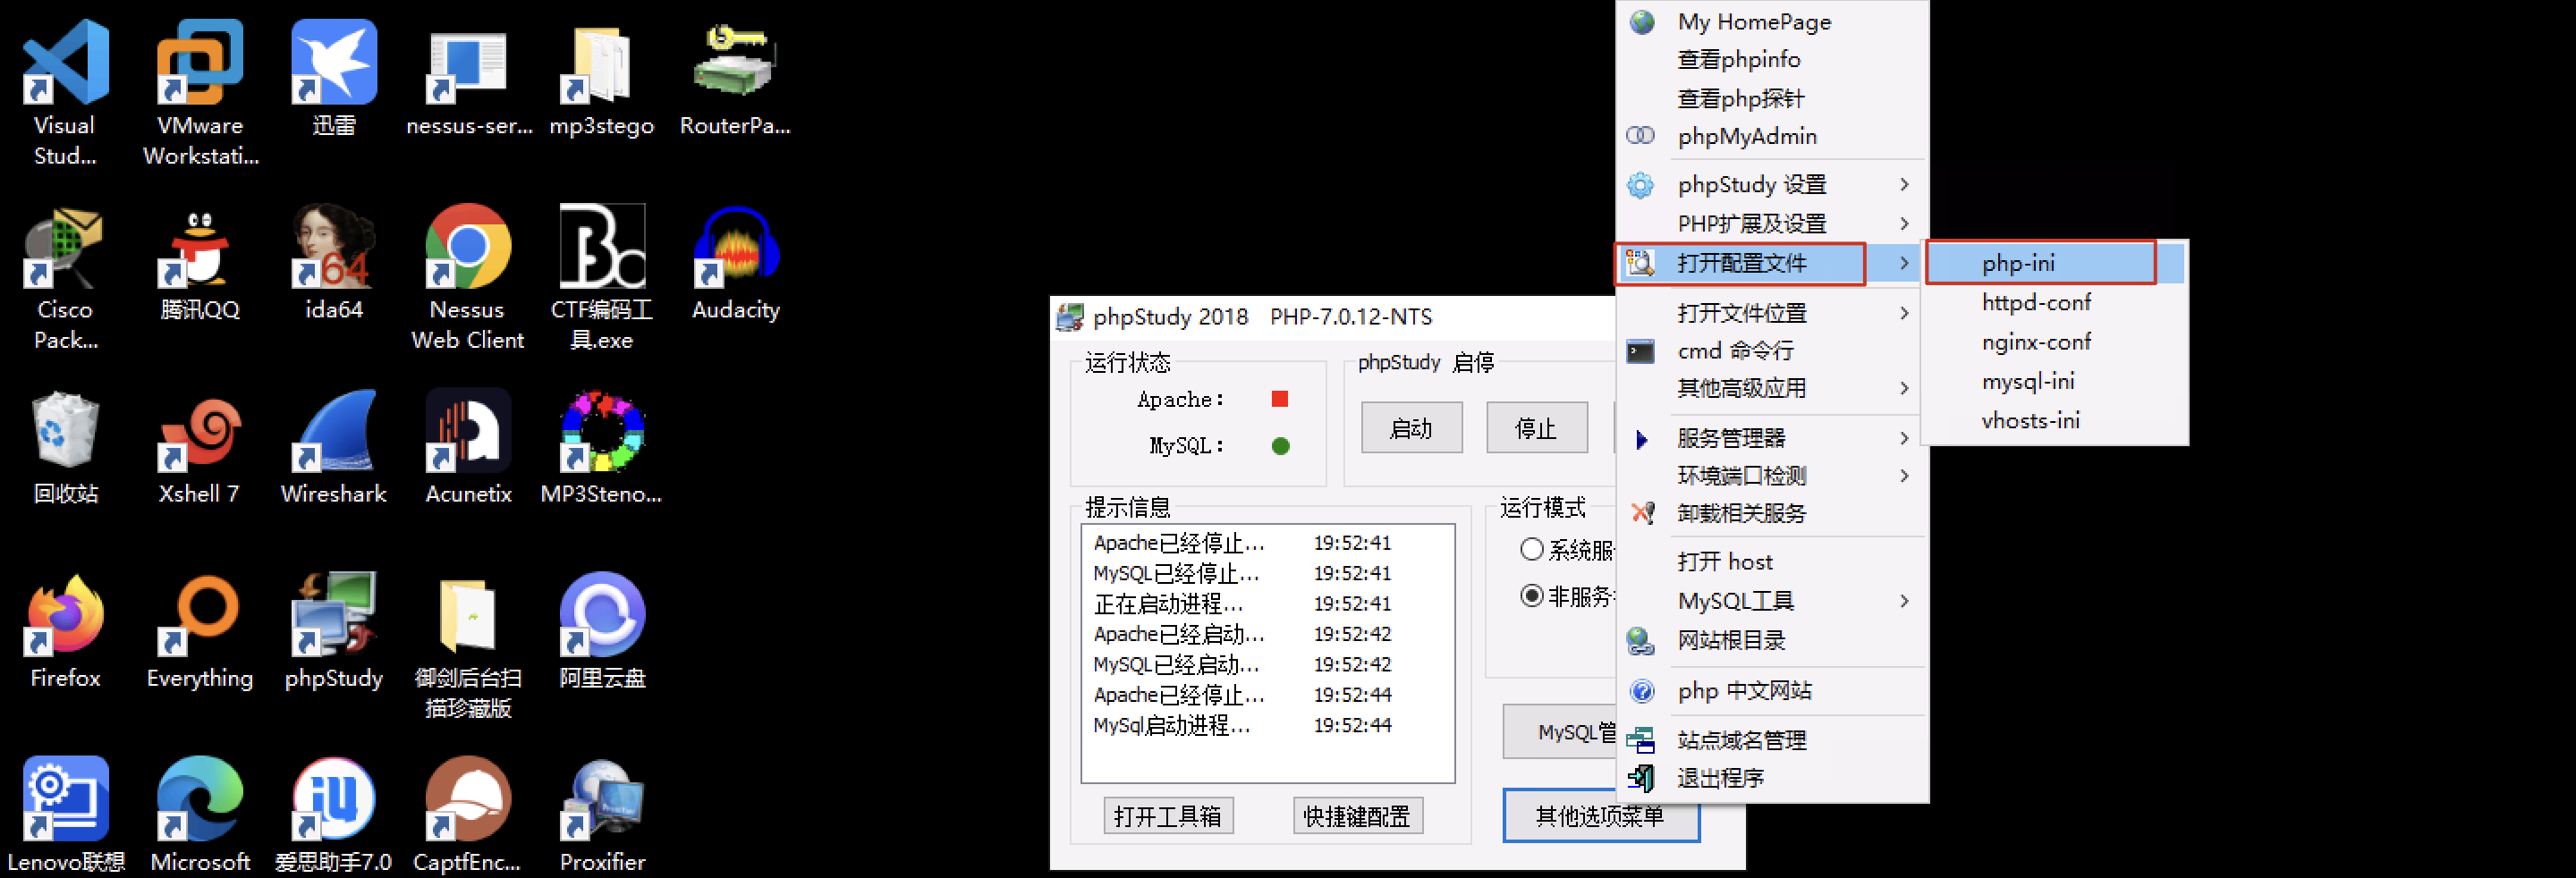
phpstudy 配置
打开 phpstudy 软件选择 其他选项菜单 -> 打开配置文件 -> php.ini
搜索 xdebug 关键字,添加或修改为如下配置:
1
2
3
4
5
6
7
8
9
10
| [XDebug]
xdebug.profiler_output_dir="D:\phpStudy\PHPTutorial\tmp\xdebug"
xdebug.trace_output_dir="D:\phpStudy\PHPTutorial\tmp\xdebug"
zend_extension="D:\phpStudy\PHPTutorial\php\php-7.0.12-nts\ext\php_xdebug.dll"
xdebug.remote_enable=1
xdebug.remote_autostart=1
xdebug.remote_port= 9003
xdebug.remote_host = localhost
|
本地调试
本地调试与macos一致。这里不再赘述。

 微信
微信 支付宝
支付宝